Background
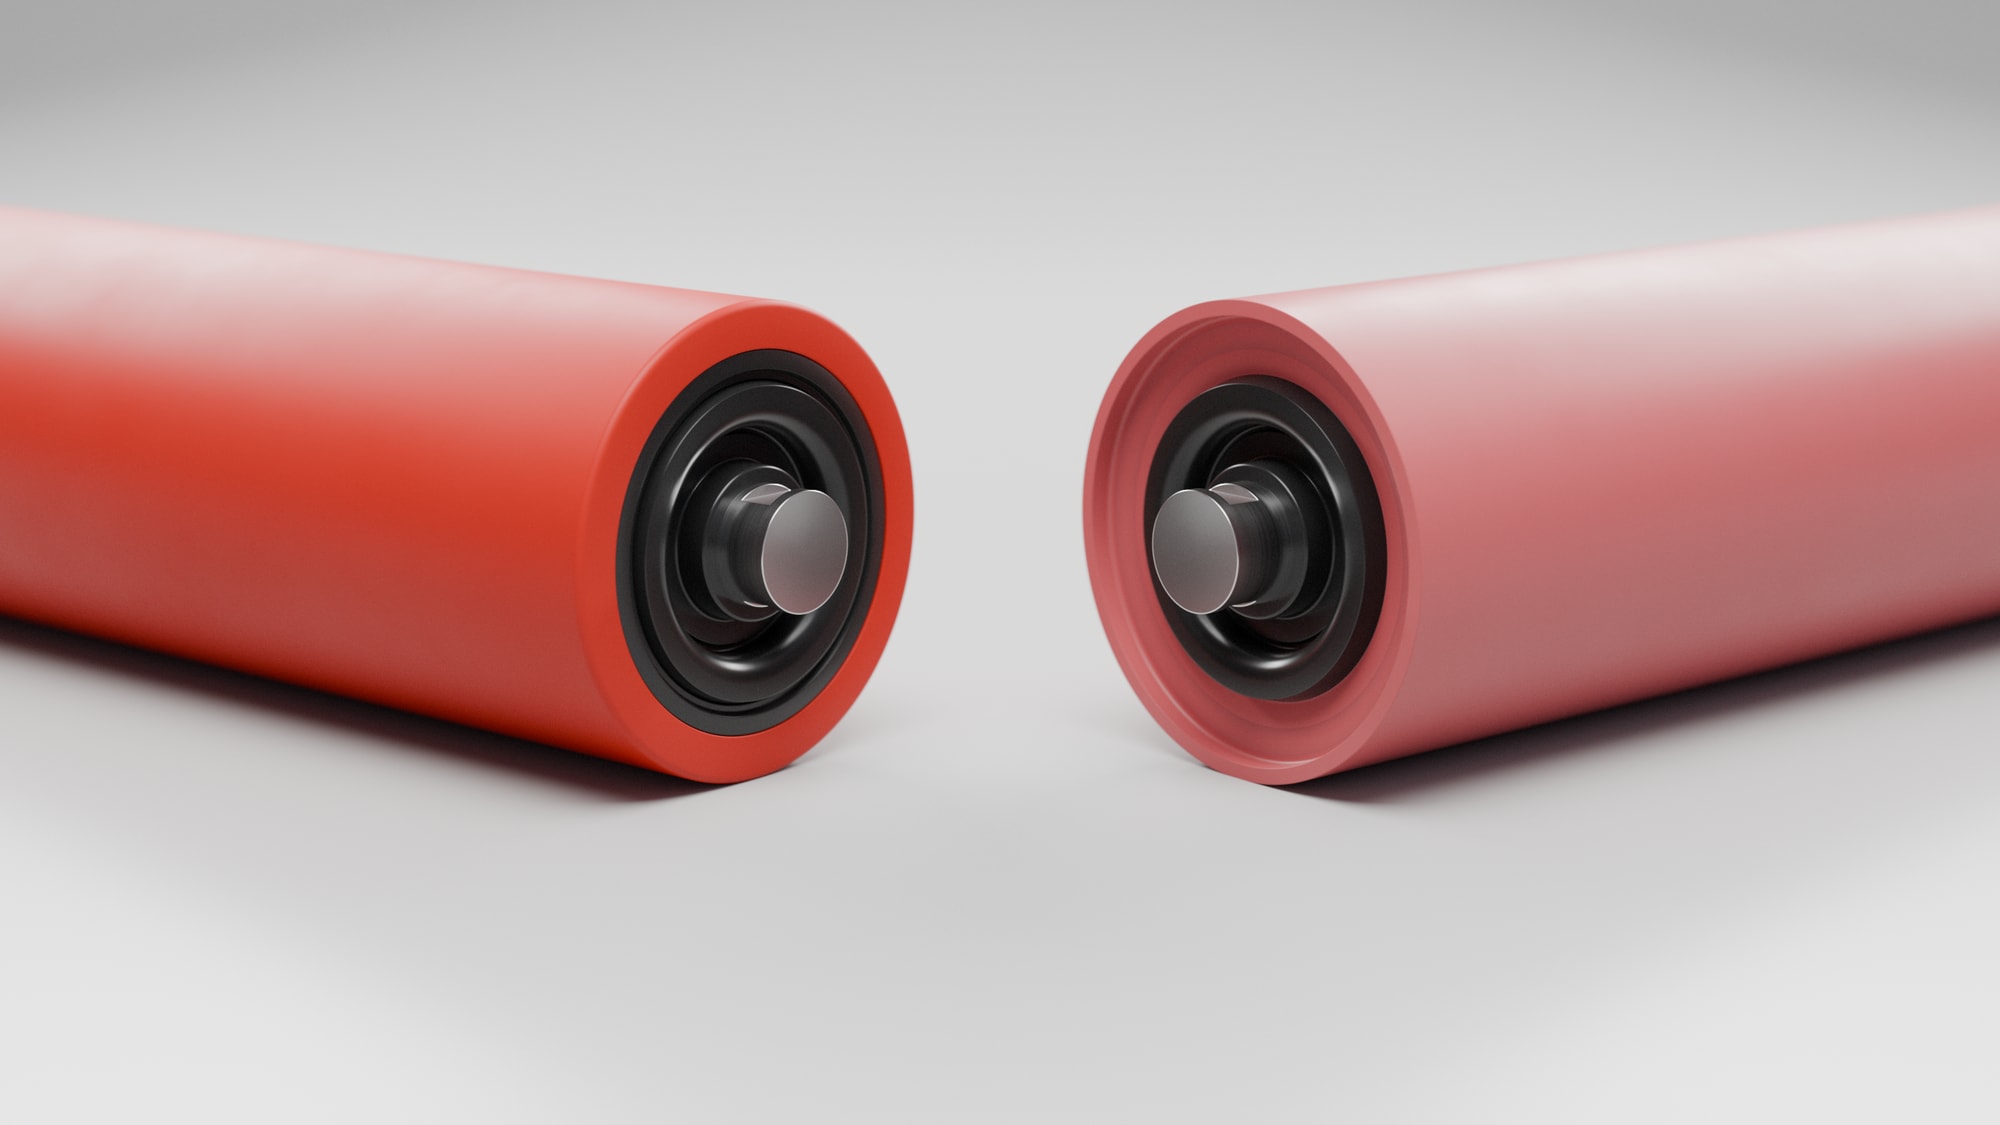
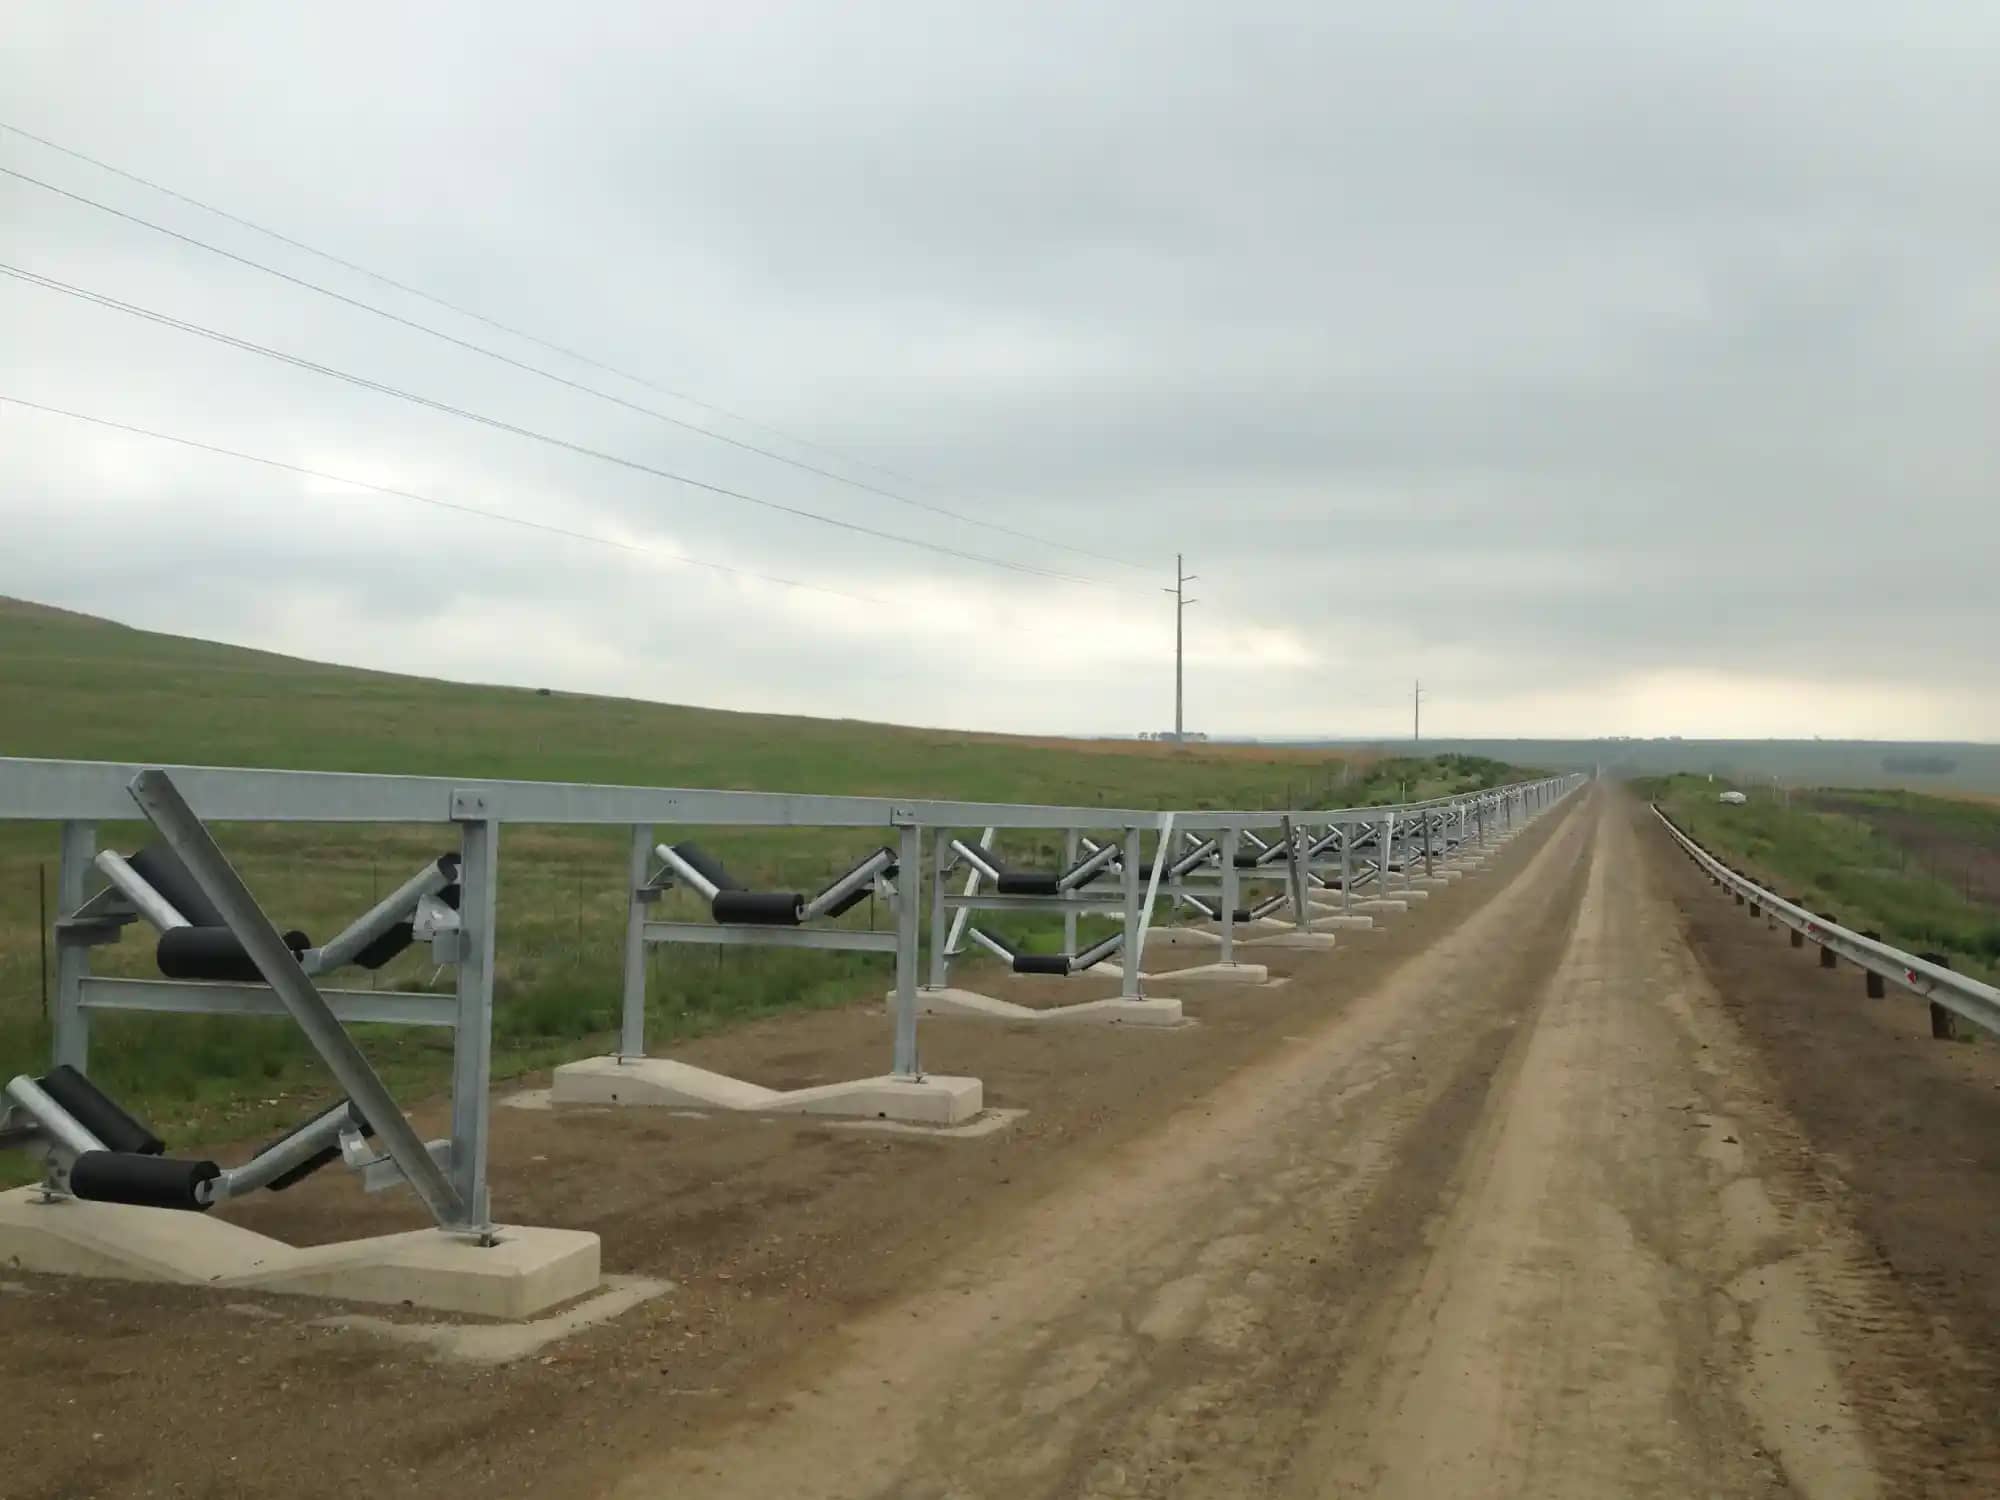
The Impumelelo overland conveyor in Mpumalanga, South Africa, described in full on the Impumelelo project page, was commissioned in October 2015. Its idlers are unusual because of the very large average idler spacings: 4.5 m in the carry strand and 9.0 m in the return strand. All rollers are of standard steel construction with HDPE lining, built to high-balance, low-TIR specifications, and the return idler uses an unconventional 3-roll 30° configuration.
85%
of the original Lorbrand rollers still turning after more than ten years and 150 million tonnes of coal
In 2026 Lorbrand audited a section of the conveyor to establish how the original rollers have performed. The headline results:
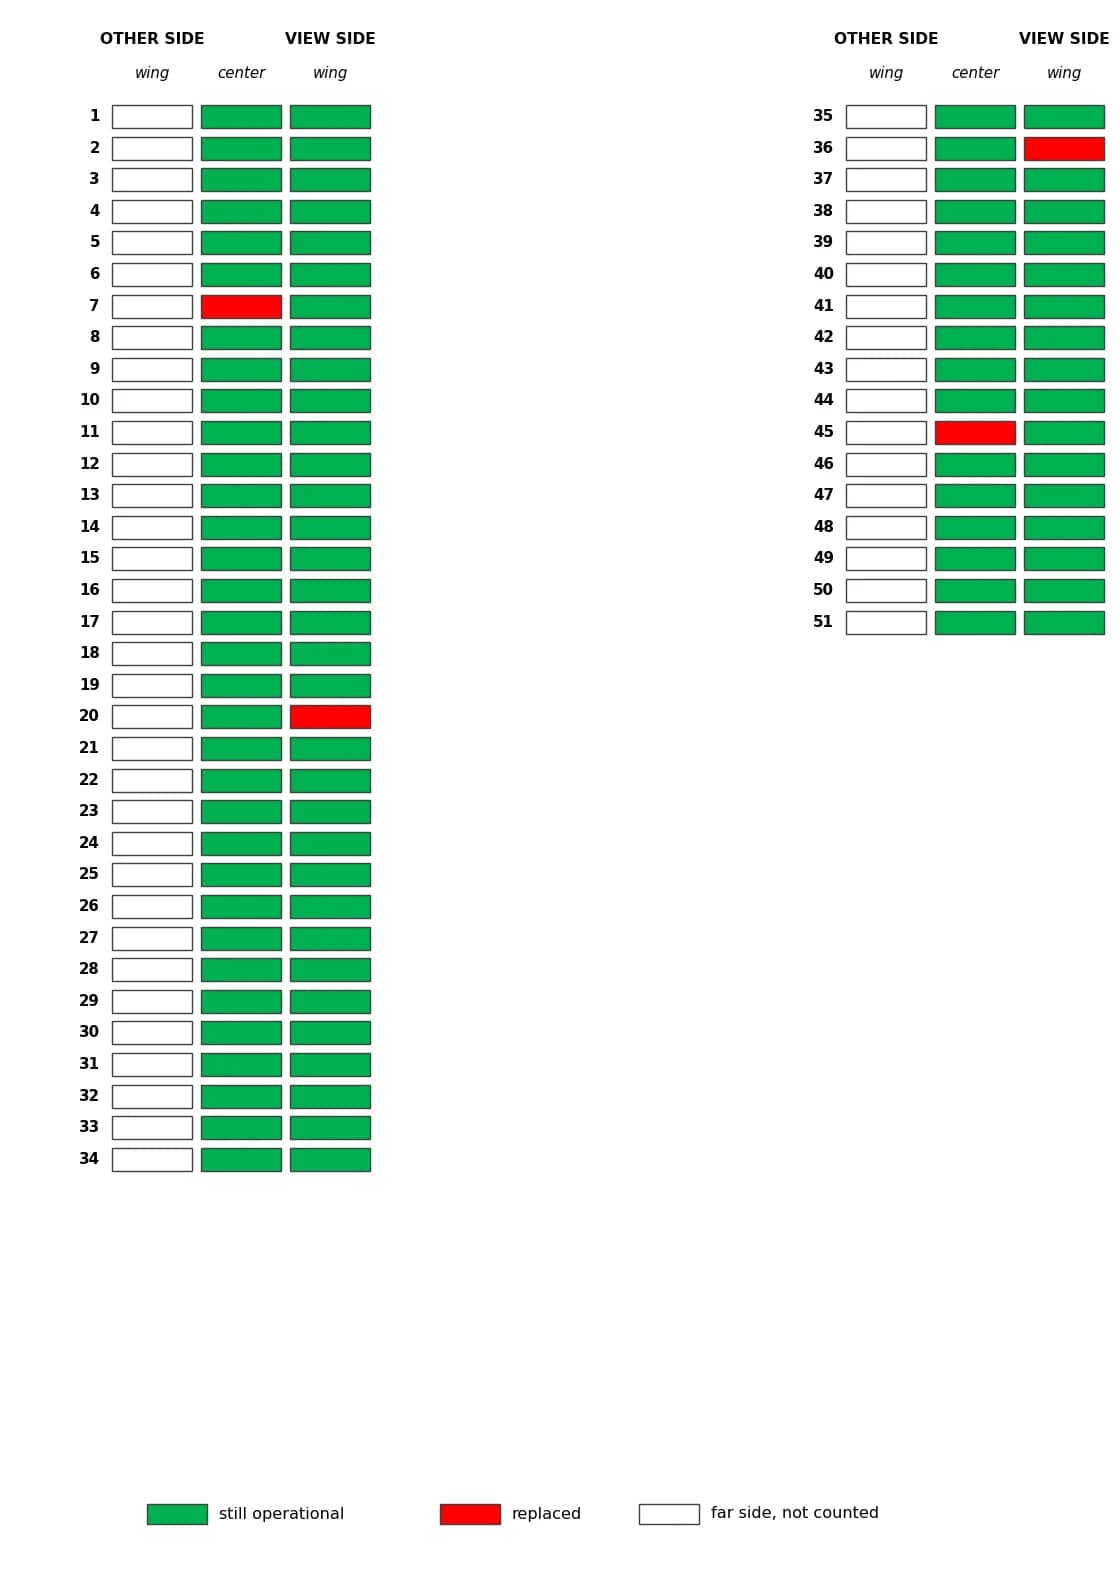
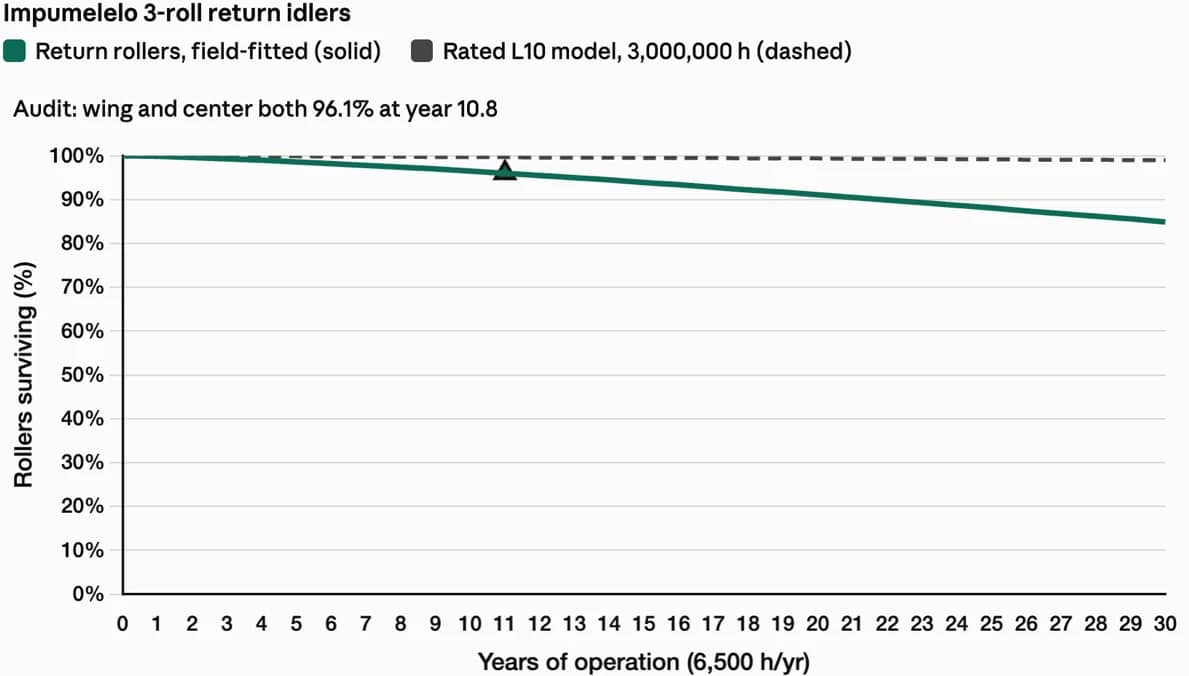
- 96% of the 3-roll return rollers are still operational after 10 years 10 months: 6 failures in 153 rollers.
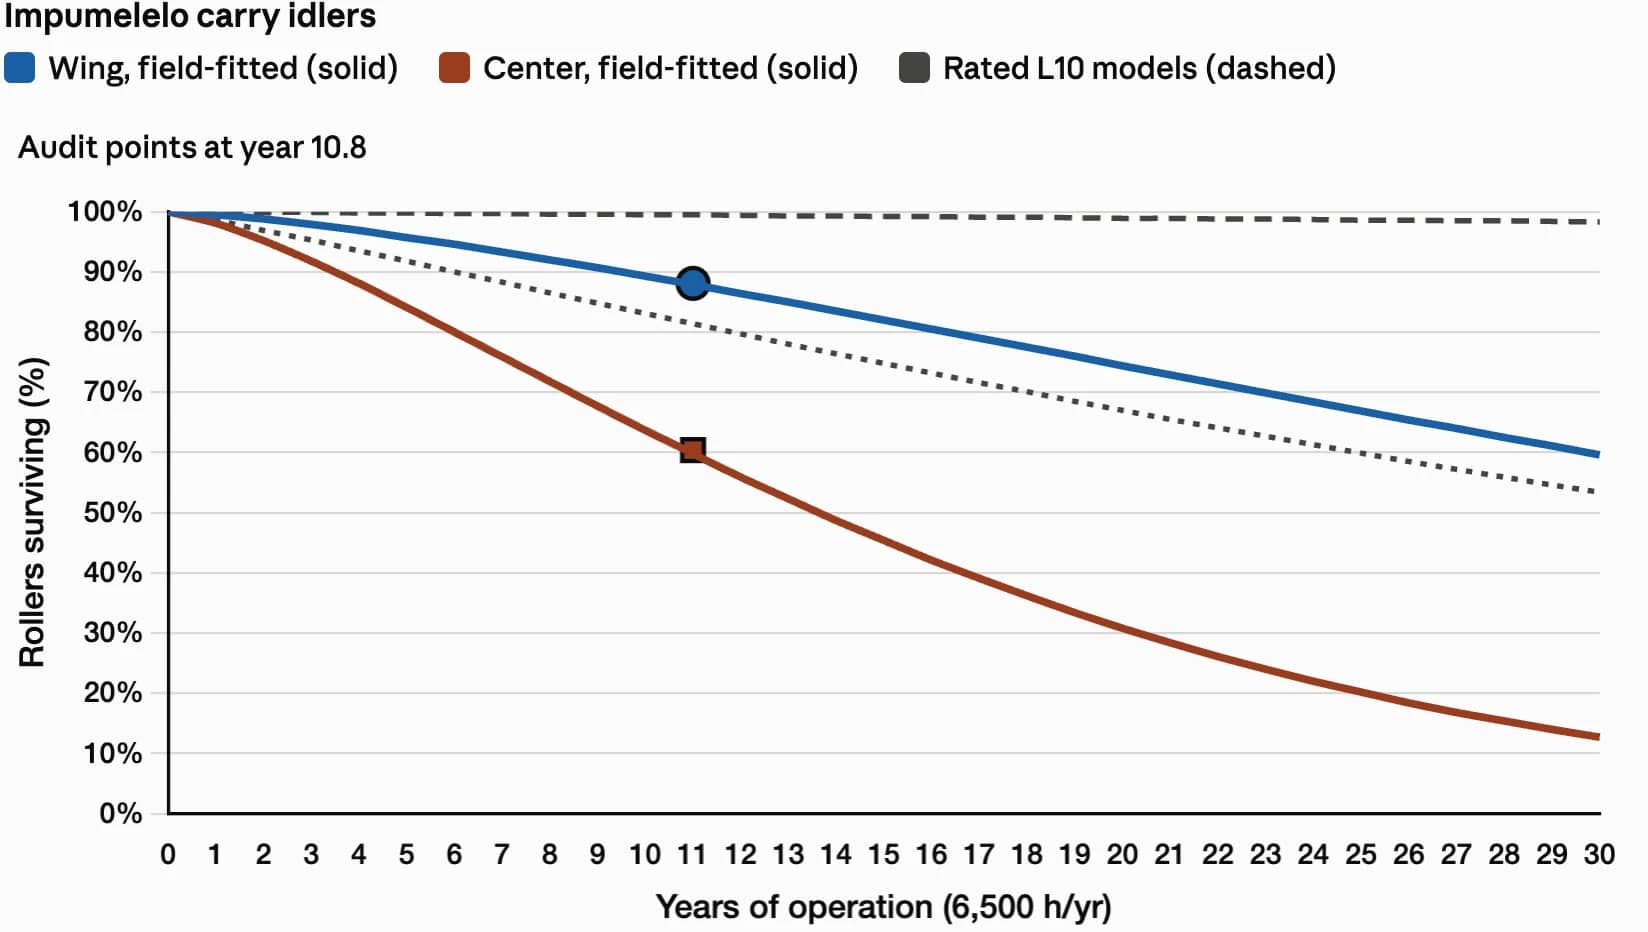
- 88% of the carry wing rollers and 60% of the heavily loaded carry centre rollers are still the original units.
- The annual failure rate ran at roughly one-third of the contractual guarantee in every one of the first five years.
The inspection
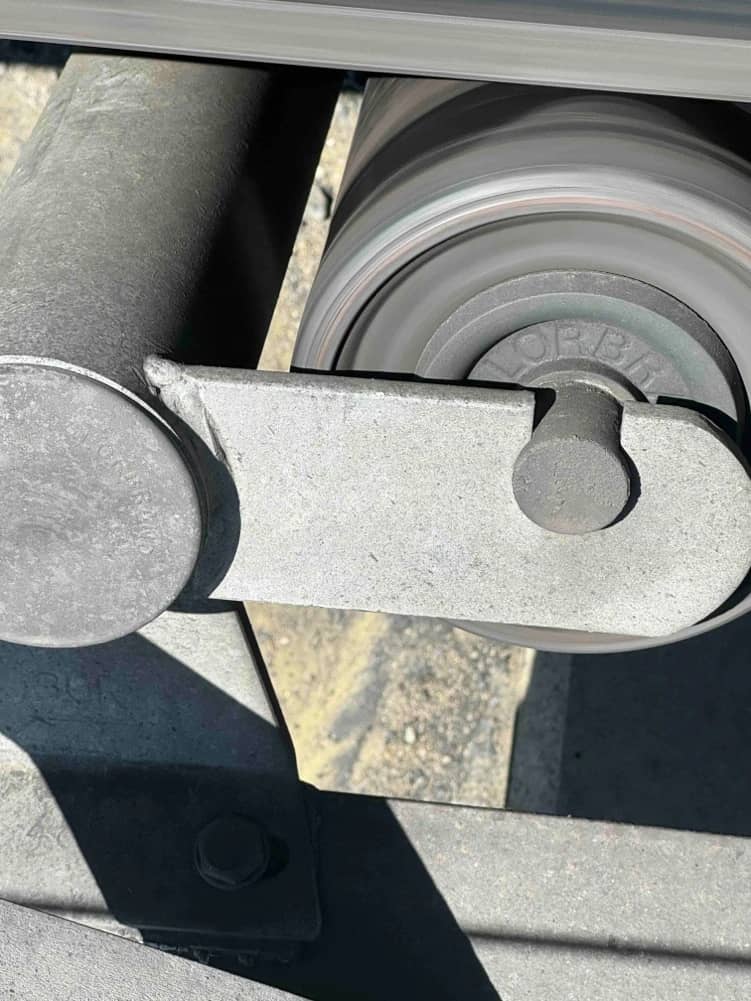
A 450 m straight section of the conveyor near the discharge end was inspected. Lorbrand has supplied no replacement rollers since commissioning, so every Lorbrand roller on the conveyor has been operating since 2015. There is no ambiguity about what was counted.
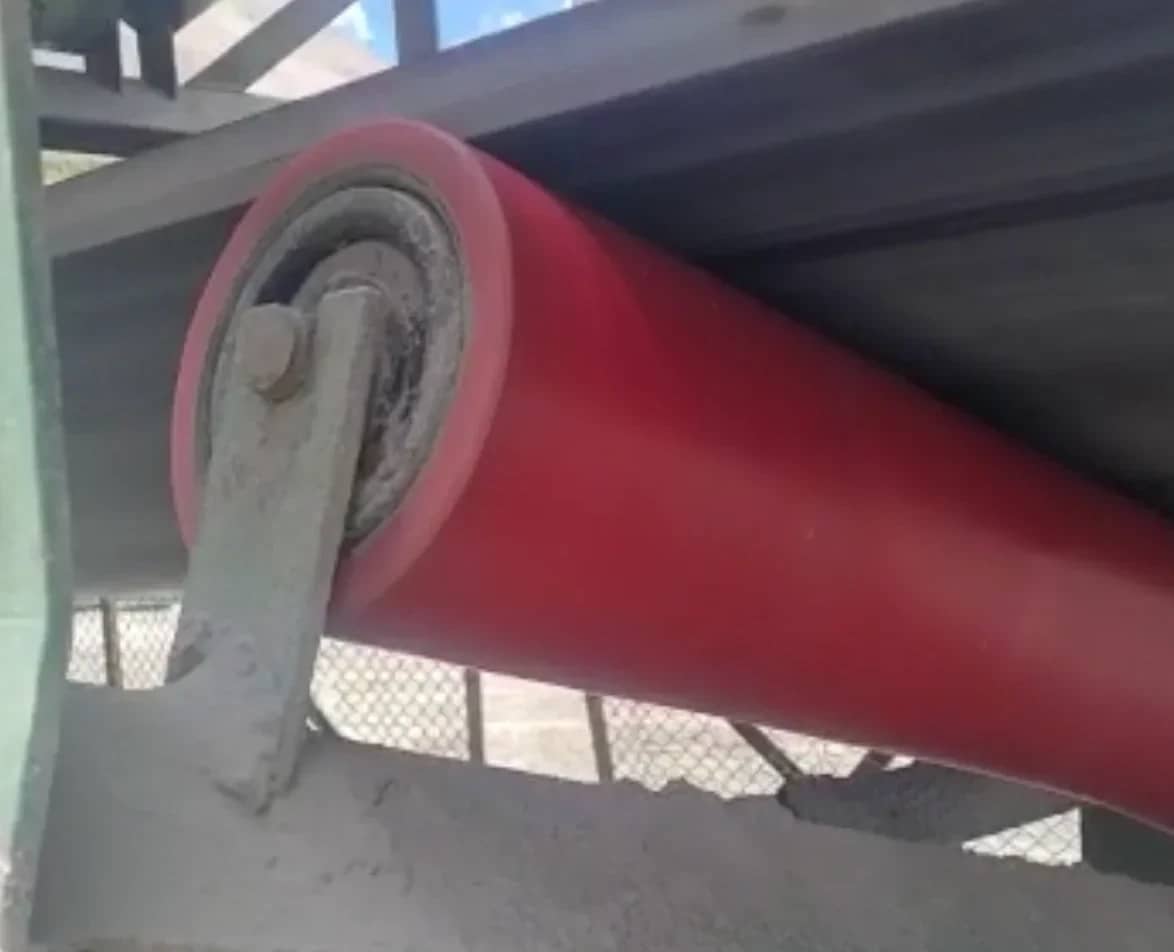
The condition of the conveyor was good, housekeeping was good, and there was no visible wear of the HDPE roller linings.
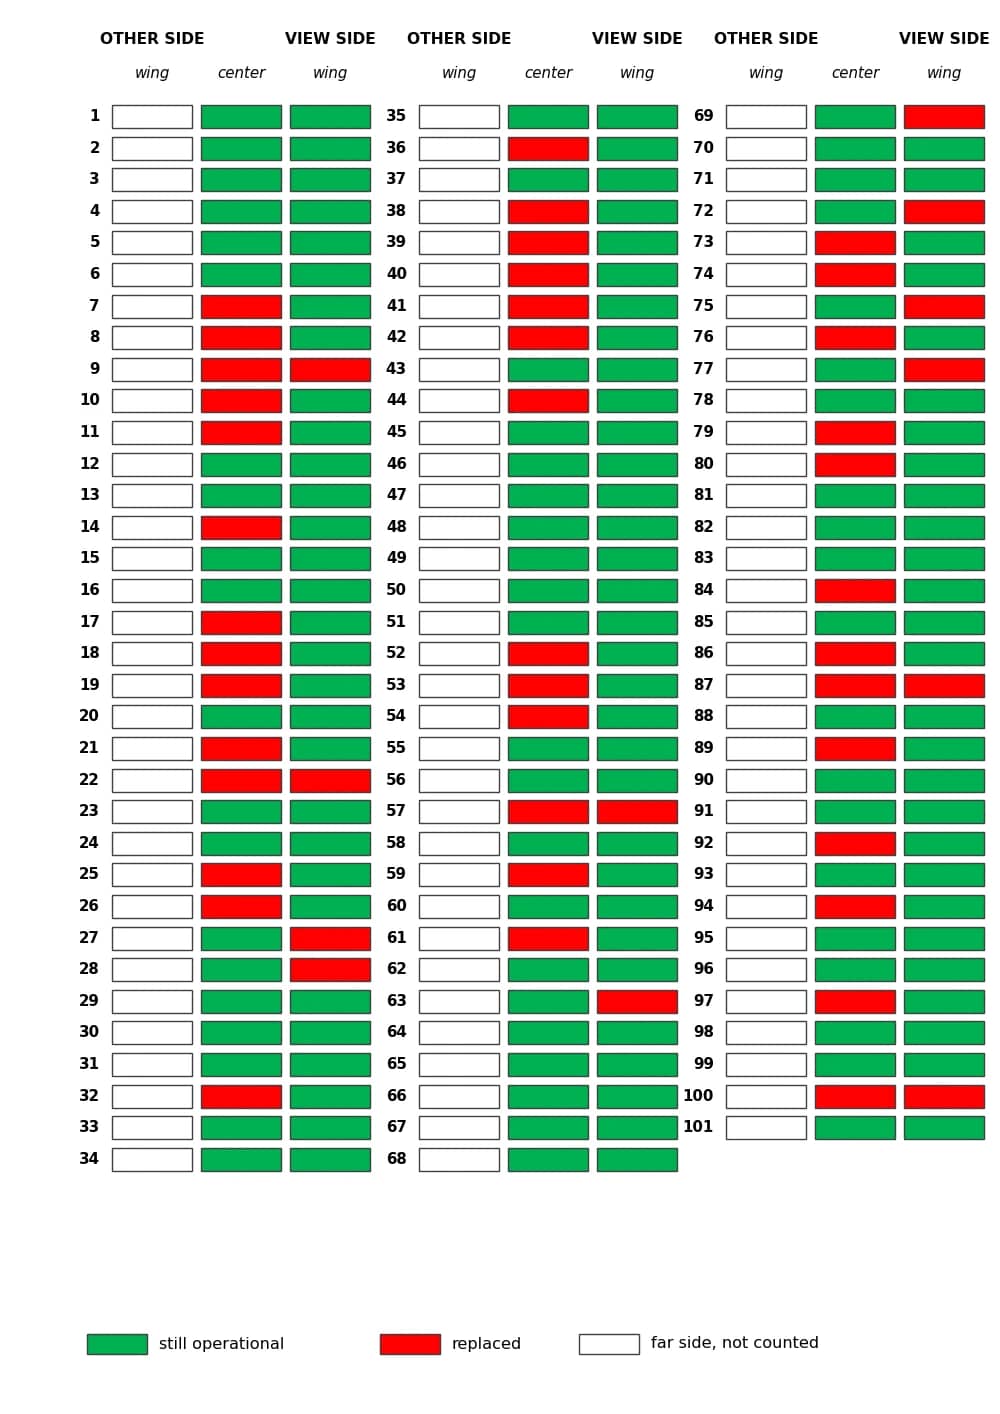
The maps below record the still-operational Lorbrand carry and return rollers (green) on the inspected section of overland conveyor CV-2301, with replaced roller positions shown in red. The unmarked positions are all wing rollers on the far side of the conveyor, which could not be accessed easily.
Roller change-out policy varies from site to site. Some sites change out only those rollers that are visibly failing or can be positively identified as failing, while other sites may also change out adjacent idlers if the exact position of the failing or noisy roller cannot be identified.
Carry idlers
Return idlers (3-roll)
The analysis
The failure rate of the far-side wing rollers is assumed to equal that of the inspected wing rollers, since their loads and every other parameter are identical. The inspected section also lies in the highest belt-tension zone of the conveyor, where roller loads, and therefore failure rates, are likely to be higher than elsewhere on the line. The results below are therefore, if anything, a conservative picture of the fleet as a whole.
How the survival curves were calculated
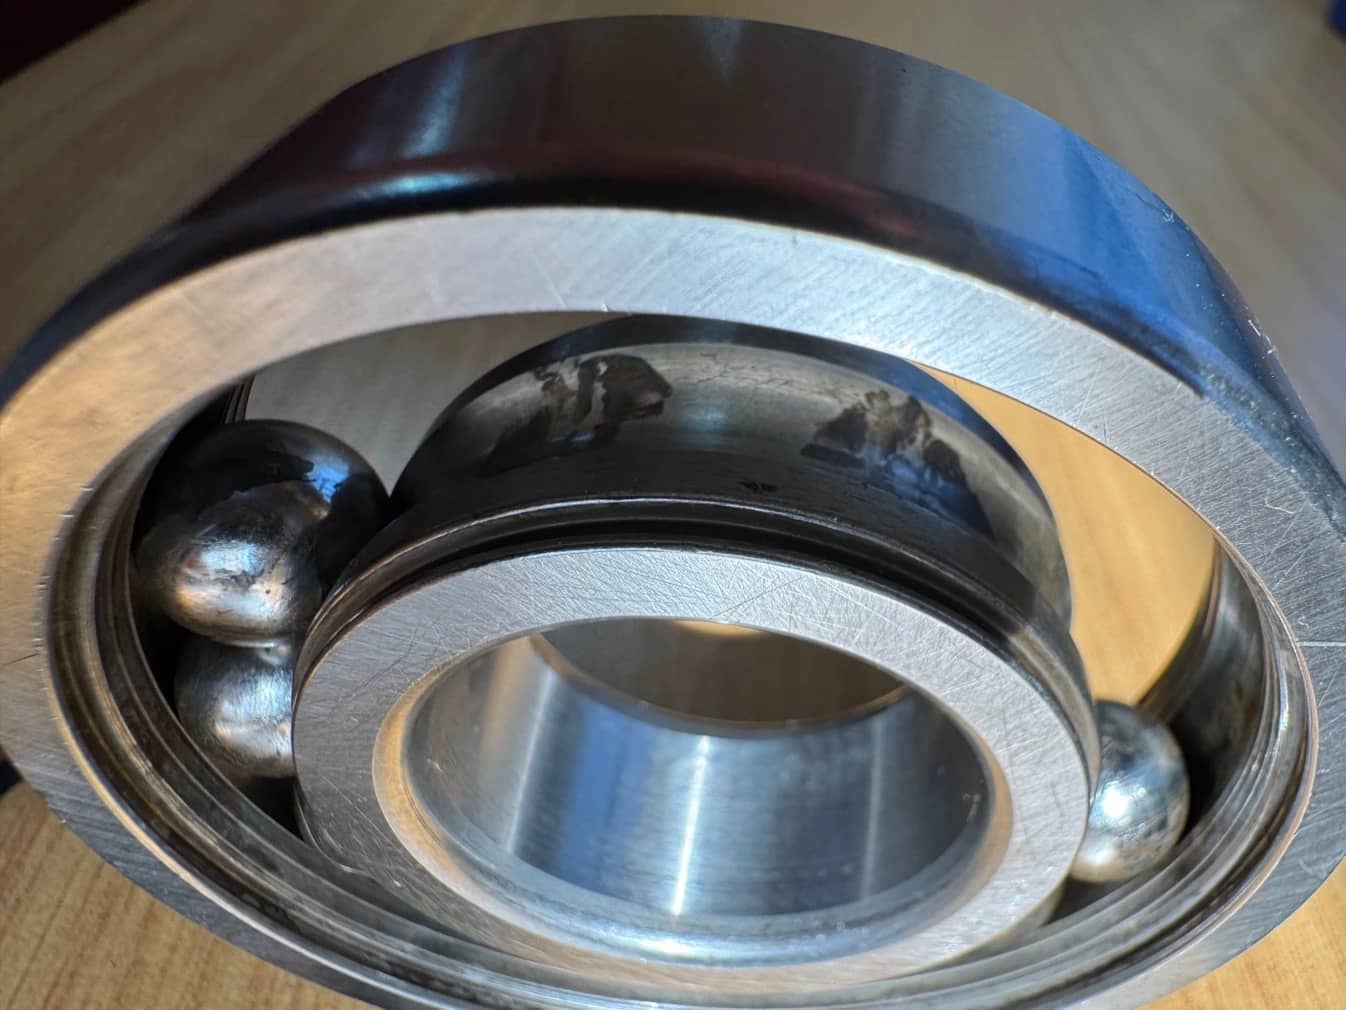
Each roller contains two bearings and is counted as failed when either bearing fails. Every removed roller was counted as a bearing failure, which is conservative: any rollers changed for other reasons are debited against the bearings.
Roller survival is modelled with a two-parameter Weibull distribution:
EQ 1 · Weibull survival function
S(t) = e^{-(t/\eta)^{\beta}}
β = 1.38 from Lorbrand's 26-year Batu Hijau field dataset; η fitted per roller position to the audit point at 70,417 h.
The slope β = 1.38 is not assumed from a textbook. It was established from Lorbrand's 26-year field dataset at Batu Hijau, Indonesia, and describes the real-world scatter of idler bearing lives in service. The characteristic life η of each roller position was then fitted so that its curve passes exactly through the audit point: the surviving fraction observed at 70,417 operating hours (10 years 10 months at 6,500 h per year). The dashed reference curves in the figures show the conventional prediction from the calculated bearing L10 ratings alone. The gap between dashed and solid is the difference between laboratory fatigue ratings and real conveyor service.
Carry idlers
| End year | Wing survival % | Centre survival % | Avg. survival % | Cumul. failed % | Failure rate pa, % of survivors | Failure rate pa, % of installed |
|---|---|---|---|---|---|---|
| 0 | 100.00 | 100.00 | 100.00 | 0.00 | – | – |
| 1 | 99.53 | 98.14 | 99.07 | 0.93 | 0.932 | 0.932 |
| 2 | 98.78 | 95.23 | 97.60 | 2.40 | 1.483 | 1.469 |
| 3 | 97.88 | 91.80 | 95.85 | 4.15 | 1.790 | 1.747 |
| 4 | 96.86 | 88.05 | 93.92 | 6.08 | 2.014 | 1.931 |
| 5 | 95.75 | 84.10 | 91.86 | 8.14 | 2.192 | 2.059 |
| 6 | 94.56 | 80.02 | 89.72 | 10.28 | 2.337 | 2.147 |
| 7 | 93.32 | 75.90 | 87.51 | 12.49 | 2.459 | 2.206 |
| 8 | 92.02 | 71.78 | 85.27 | 14.73 | 2.561 | 2.241 |
| 9 | 90.67 | 67.69 | 83.01 | 16.99 | 2.648 | 2.258 |
| 10 | 89.29 | 63.67 | 80.75 | 19.25 | 2.721 | 2.259 |
| 11 | 87.88 | 59.75 | 78.50 | 21.50 | 2.784 | 2.248 |
44 yrs
fitted mean life of the carry wing rollers (≈287,000 h); the heavily loaded centre rollers fit at ≈106,000 h, about 16 years
The fitted curves put the mean carry roller life at approximately 287,000 hours (about 44 years) for the wing rollers and 106,000 hours (about 16 years) for the heavily loaded centre rollers. The centre position carries the highest calculated bearing load on the conveyor and fails accordingly.
Return idlers (3-roll)
| End year | Wing survival % | Centre survival % | Avg. survival % | Cumul. failed % | Failure rate pa, % of survivors | Failure rate pa, % of installed |
|---|---|---|---|---|---|---|
| 0 | 100.00 | 100.00 | 100.00 | 0.00 | – | – |
| 1 | 99.85 | 99.85 | 99.85 | 0.15 | 0.149 | 0.149 |
| 2 | 99.61 | 99.61 | 99.61 | 0.39 | 0.239 | 0.238 |
| 3 | 99.32 | 99.32 | 99.32 | 0.68 | 0.291 | 0.290 |
| 4 | 99.00 | 99.00 | 99.00 | 1.00 | 0.331 | 0.328 |
| 5 | 98.63 | 98.63 | 98.63 | 1.37 | 0.364 | 0.360 |
| 6 | 98.25 | 98.25 | 98.25 | 1.75 | 0.393 | 0.388 |
| 7 | 97.84 | 97.84 | 97.84 | 2.16 | 0.419 | 0.412 |
| 8 | 97.40 | 97.40 | 97.40 | 2.60 | 0.442 | 0.433 |
| 9 | 96.95 | 96.95 | 96.95 | 3.05 | 0.464 | 0.452 |
| 10 | 96.48 | 96.48 | 96.48 | 3.52 | 0.484 | 0.469 |
| 11 | 96.00 | 96.00 | 96.00 | 4.00 | 0.503 | 0.485 |
With only 6 failures in 153 rollers after nearly 11 years, the return rollers are performing at a different level again. The fitted mean life extrapolates to more than 600,000 hours: on paper over 100 years, and in practical terms simply the life of the installation. Even the conservative B10 measure (10% of rollers failed) sits at around 142,000 hours, or more than 21 years of continuous operation.
Combined roller life
Weighting the carry and return populations by their installed numbers (303 and 153 rollers respectively, a ratio of 1.980) gives the overall picture for the conveyor:
| End year | Avg. survival % | Cumul. failed % | Failure rate pa, % of survivors | Failure rate pa, % of installed |
|---|---|---|---|---|
| 0 | 100.00 | 0.00 | – | – |
| 1 | 99.33 | 0.67 | 0.669 | 0.669 |
| 2 | 98.28 | 1.72 | 1.063 | 1.056 |
| 3 | 97.02 | 2.98 | 1.280 | 1.258 |
| 4 | 95.62 | 4.38 | 1.436 | 1.393 |
| 5 | 94.14 | 5.86 | 1.557 | 1.489 |
| 6 | 92.58 | 7.42 | 1.654 | 1.557 |
| 7 | 90.97 | 9.03 | 1.732 | 1.604 |
| 8 | 89.34 | 10.66 | 1.796 | 1.634 |
| 9 | 87.69 | 12.31 | 1.849 | 1.652 |
| 10 | 86.03 | 13.97 | 1.891 | 1.659 |
| 11 | 84.37 | 15.63 | 1.926 | 1.657 |
Median life
Half of all installed rollers would be replaced at approximately 245,000 hours, or 37 to 38 years at 6,500 operating hours per year.
Measured against the project guarantee, the actual failure rate in each of the first five years of operation was about one-third of Lorbrand's contractual commitment, under either definition of the rate:
| Year | Guarantee limit, % pa | Actual failure rate pa, % of survivors | Actual failure rate pa, % of installed | Within limit? |
|---|---|---|---|---|
| 1 | 2.0 | 0.669 | 0.669 | PASS |
| 2 | 2.5 | 1.063 | 1.056 | PASS |
| 3 | 3.0 | 1.280 | 1.258 | PASS |
| 4 | 3.5 | 1.436 | 1.393 | PASS |
| 5 | 4.0 | 1.557 | 1.489 | PASS |
PASS requires both rate definitions to sit within the limit.
Beyond the guarantee period the annual failure rate has settled into a narrow band of roughly 1.6 to 1.9% per annum, and is still dominated by the one position, the carry centre roller, that carries the highest bearing load.
Conclusions
Idler failure rates on Impumelelo are extremely low, and the failures rank exactly in line with calculated bearing load: the heavily loaded carry centre rollers fail fastest, the carry wing rollers far more slowly, and the lightly loaded return rollers barely at all. That is the signature of a healthy installation, with failures driven by load-related bearing fatigue rather than by contamination, sealing problems or misalignment.
Lorbrand's idlers have performed exceptionally well considering the very large idler spacings and the high belt speed, conditions that concentrate more load onto every single roller than on any conventional overland conveyor. Credit must also go to Conveyor Dynamics Inc. and ELB Engineering Services for the ground-breaking engineering, and to Sasol Coal for the operation and upkeep of this remarkable conveyor.
Ten years and 150 million tonnes in, Impumelelo is proof of what carefully engineered, precisely manufactured idlers deliver when they are asked to do more: wider spacing, higher speed, heavier duty. They simply keep turning.